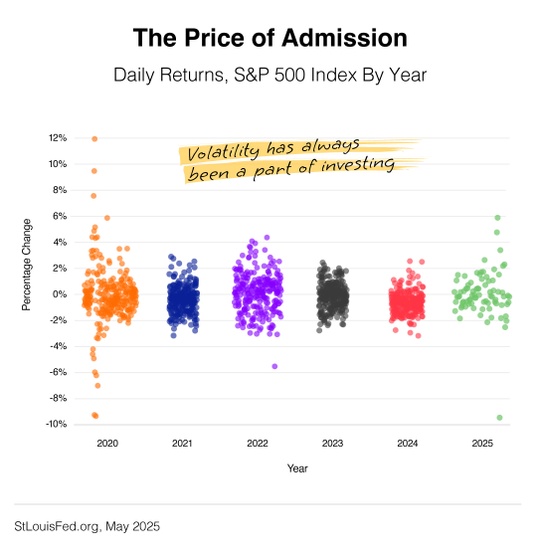
Look at the headlines lately, and it becomes clear that markets may be in for a ride that’s hard to predict— but we’ve seen this kind of turbulence before. When times feel uncertain, we know how crucial it is to maintain a broad and measured perspective. Historically, volatility isn’t an anomaly—it’s a typical part of the investment landscape.

This month’s chart illustrates this in a pretty cool way. If we look at the percentage change from year to year, we see that market fluctuations are not only expected but a normal aspect of investing.
Historically, stock prices have seen consistent corrections:
- A 5 percent downturn is almost a yearly occurrence.1
- The intra-year drawdown from 1928 to 2023 was -16.4 percent on average, with a correction of -13.7 percent being the average since 1950.1
It’s common for markets to experience corrections during the year. For instance, did you know that half of the years with positive returns, double-digit corrections occurred?
While no one can predict the future, and conditions can vary, history teaches us that enduring both gains and losses is typical in stock investing. Remember, a single week (or month) won’t define the market, and volatility is the price of admission.

If you have any questions about navigating these fluctuations, feel free to reach out.
- StLouisFed.org, May 2025. ↩︎


